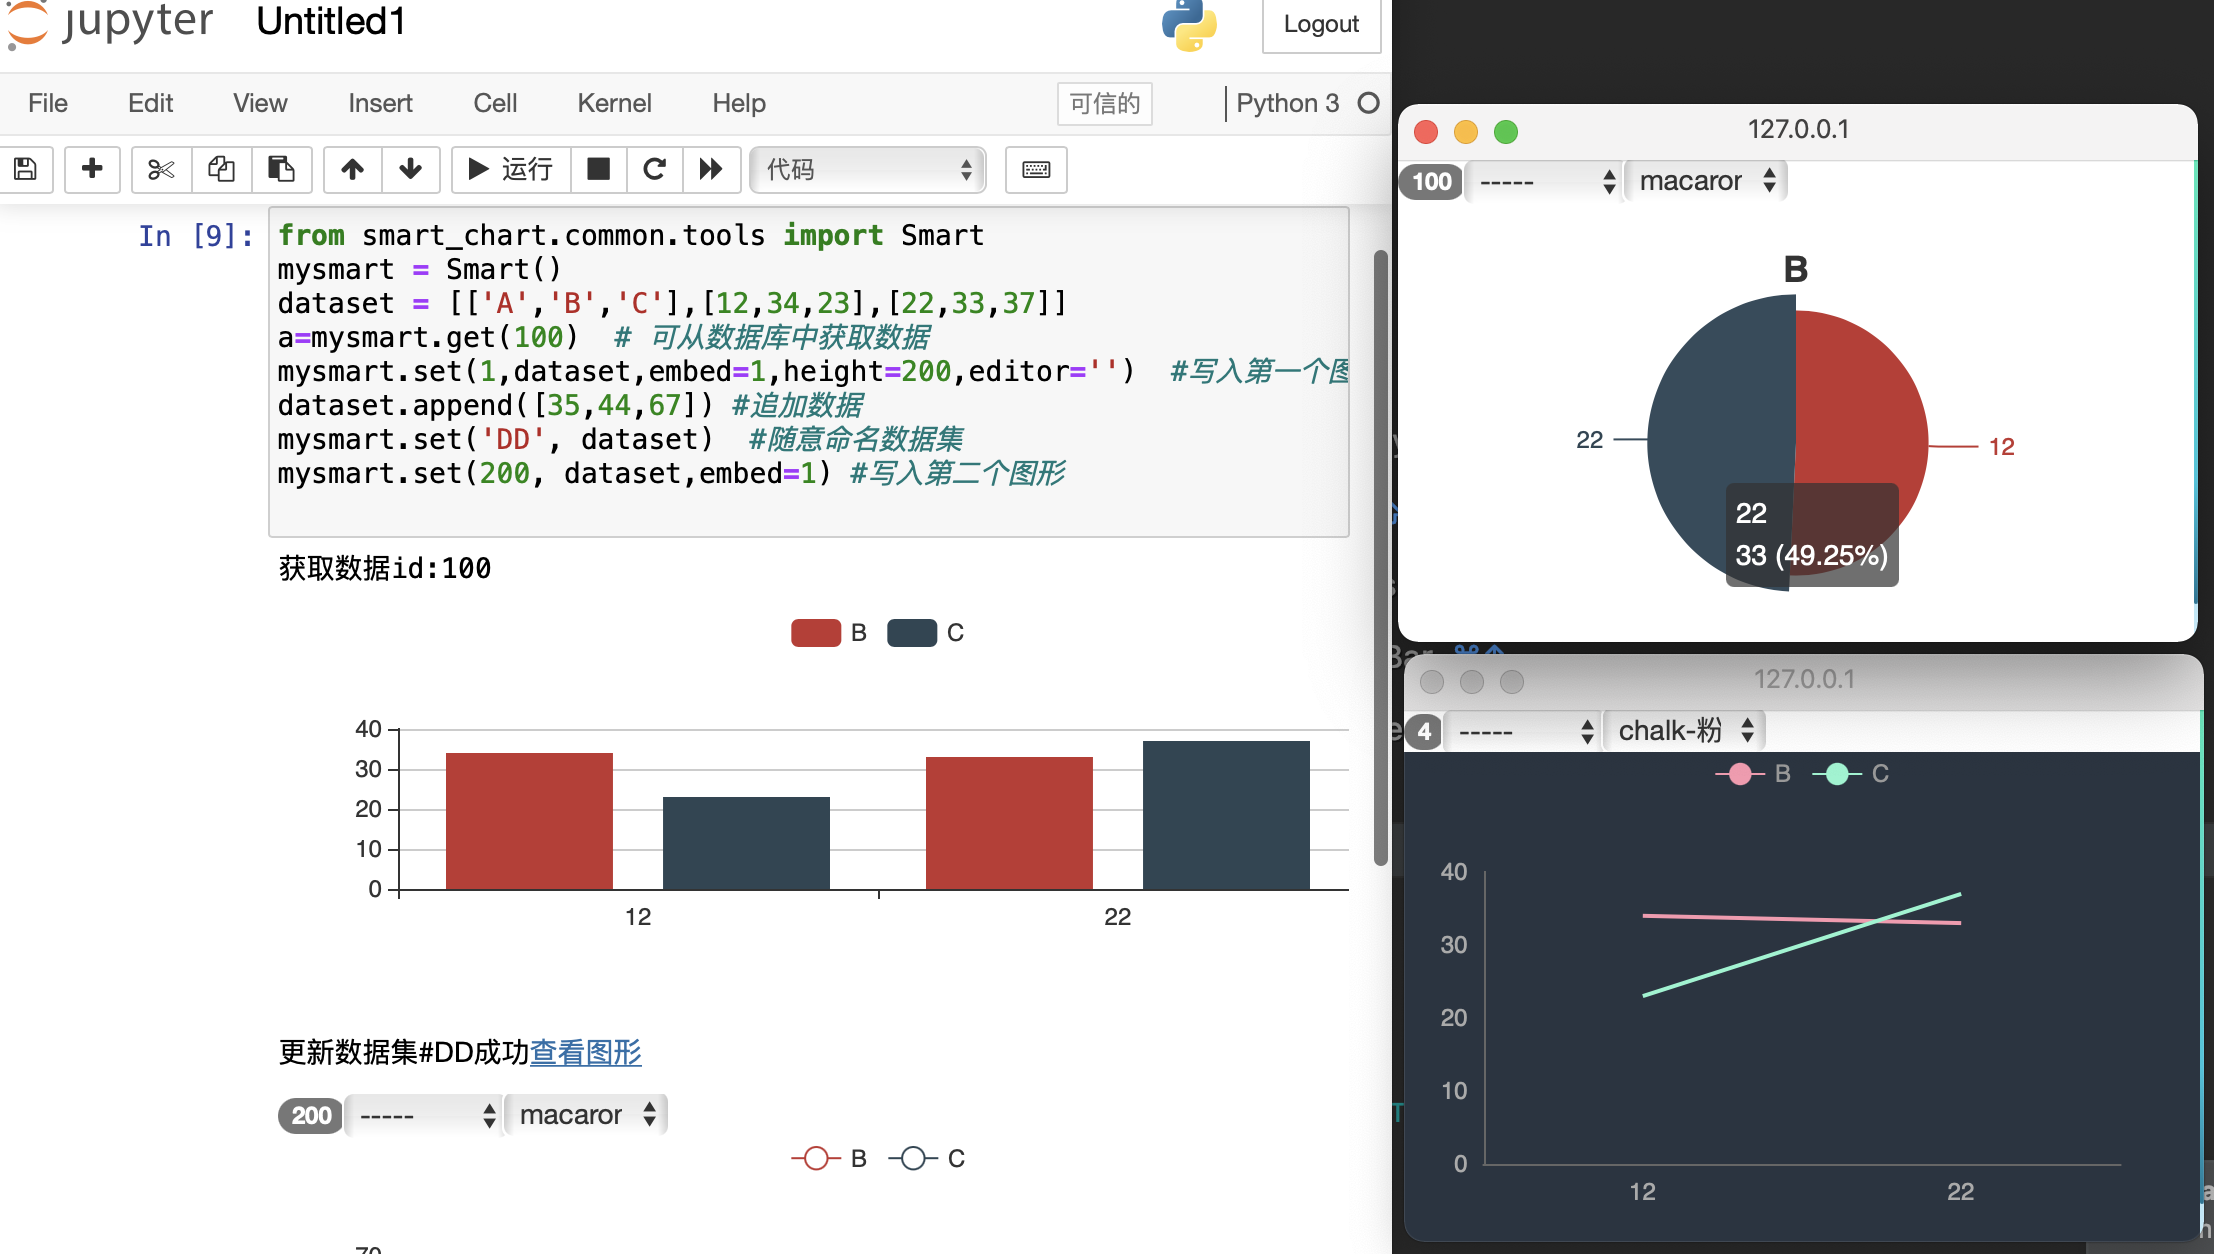
支持像pyecharts,Matplotlib等python绘图工具一样在Jupyter中使用, 更加方便, 更加炫酷 仅仅只有两个命令,get and set, 简化数据分析工作

开源地址:
from smart_chart.common.tools import Smart
mysmart = Smart()
dataset = [['A','B','C'],[12,34,23],[22,33,37]]
 # 可从数据库中获取数据, id 为smarchart中的数据集id
a=mysmart.get(100)
 #把数据写入数据集并显示图形
mysmart.set(1,dataset,embed=1,height=200,editor='')
dataset.append([35,44,67]) #追加数据
 #随意命名数据集, 不一定需要smartchart中数据集已有的
mysmart.set('DD', dataset)
mysmart.set('barxxx', dataset)  #显示柱形数, 另外还有linexxx, piexxx

####### dateset也可以直接是pandas的df ########
import pandas as pd
# 从数据集1中获取数据直接转成pandas df
df = pddf(1)
# 读取excel数据
df = pd.read_excel('manual_smartdemo.xlsx', 'sheet1')
#sample = df.sample(10)
#mysmart.set('df0', sample)
df1 = df.groupby('province').agg({'qty':'sum'}).reset_index()
mysmart.set('pie', df1)

####### 你也可以全局初始化设定 #######
mychart = Smart(width=xx, height=xx, embed=1, editor='')
# width, height指定图形嵌入显示的宽高
# embed 默认不嵌入, embed=1 嵌入, embed='' 不嵌入
# editor 是否显示图形菜单
# push 是否持久化数据集  push=1, 无则新建有则保存数据

 沙发,很寂寞~


